Oracle DB Time
We all know that time is important and every DBA goal should be to reduce to a minimum end-user response time and resources used by each request. With this post I’ll try to give explanation for database time, elapsed time and active session history. Someone might find this information useful to understand the basis for performance tuning. Oracle came up with database time (DB time) definition to measure time spent by all active sessions in the database. Some main database performance measurement techniques are dependent on database time, such as Active Session History (known as ASH) or Average Session Activity (% Activity) which we see in the Enterprise Manager charts. The goal for tuning process should be to reduce to minimum CPU time and Wait time so that more transactions can be processed.
DB time definition:
Database time is total time spent by user processes either actively working or actively waiting in a database call.
In other words DB Time = CPU time + I/O time + Non-idle wait time I/O wait event is included into Non-idle wait events, but I’ve put it as separate unit just for clarification. From this we can conclude that database requests are composed from CPU (service time, performing some work) and wait time (session is waiting for resources). Wait events in Oracle are grouped into wait event classes, there are total of 13 Wait Event Classes (Administrative, Application, Cluster, Commit, Concurrency, Configuration, Idle, Network, Other, Queue, Scheduler, System I/O, User I/O).
Understanding database time also involves two main crucial parts that we need to understand first, those are “Active Session” and “Average Active Session (% Activity)”.
Active session = session currently running (spending time) in a database call. (sessions with status=ACTIVE in v$session view). Average activity of a single session = the ratio of active time to total wall clock time (elapsed time).
So, if I have a single session running for 2 minutes (120 seconds) and from those 2 minutes only 45 seconds are spend in database calls, the “% Activity” for the session would be 45 / 120 = 0.375 or in percents 0.375 * 100 = 37.5 % of DB time.
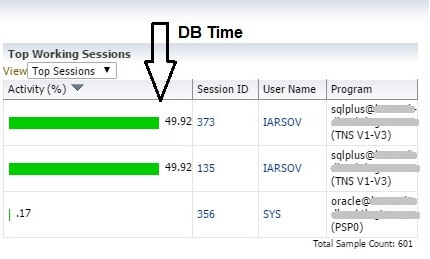
This is what we see in Top Sessions chart from Top Activity page.
Database time in Oracle is collected from instance startup as cumulative statistic and it can be found in v$SYSSTAT dictionary view.
SQL> col name format a10
SQL> select statistic#, name, class, value
  2  from v$sysstat
  3  where name = 'DB time'
  4  /

STATISTIC# NAME            CLASS      VALUE
---------- ---------- ---------- ----------
        20 DB time             1   17546241
There are also different metrics which are calculated based on cumulative statistics, such as database wait time ratio, database cpu time, database time per second/user call, etc. These metrics are stored in several dictionary views (v$sysmetric, v$sysmetric_summary, v$sysmetric_history, dba_hist_metric_summary).
For database time there are several metrics, one of them is Database Time Per Sec which is stored in V$SYSMETRIC dictionary view.
SQL> select to_char(begin_time,'dd.mm.yyy hh24:mi:ss') begin_time,
  2         to_char(end_time,'dd.mm.yyy hh24:mi:ss') end_time,
  3         intsize_csec interval_size,
  4         group_id,
  5         metric_name,
  6         value
  7  from   v$sysmetric
  8 where  metric_name = 'Database Time Per Sec'
  9 /

BEGIN_TIME         END_TIME           INTERVAL_SIZE   GROUP_ID METRIC_NAME                    VALUE
------------------ ------------------ ------------- ---------- ------------------------- ----------
09.01.015 10:25:48 09.01.015 10:26:48          6001          2 Database Time Per Sec     .296650558
09.01.015 10:27:03 09.01.015 10:27:18          1500          3 Database Time Per Sec     .300146667
There are 2 records for two different groups because of short duration and long duration intervals.
System Metrics Long Duration (group_id= 2) : 60 second interval System Metrics Short Duration (group_id = 3) : 15 second interval
V$SYSMETRIC_SUMMARY (with appropriate DBA_HIST_SYSMETRIC_SUMMARY for on disk snapshots) contains long duration metric (1 hour interval) information such as avg,min,max.
SQL> select maxval,minval,average,standard_deviation
  2  from v$sysmetric_summary
  3  where metric_name = 'Database Time Per Sec'
  4  /

    MAXVAL     MINVAL    AVERAGE STANDARD_DEVIATION
---------- ---------- ---------- ------------------
3.12933844          0 .282698591         .595884377
V$SYSMETRIC_HISTORY (with appropriate DBA_HIST_SYSMETRIC_SUMMARY on disk snapshots) contains short duration and long duration metrics.
Database Time and Elapsed Time
Don’t confuse database time with elapsed time, those are different time dimensions. In the following picture you can see the main difference between database time and elapsed time. Remember that DB time != Elapsed time
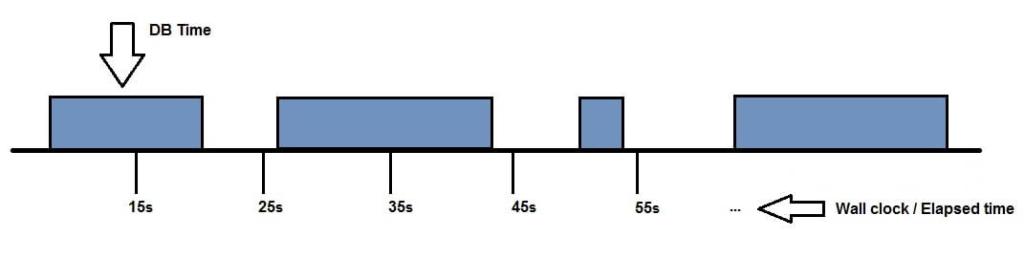
The session activity starts somewhere at 13th second from its existence, performs some work until somewhere 20th second and continues with work at somewhere 26th second and so on …
The whole time period from the existence of the session till the end of the session we call it elapsed time or wall clock time. This doesn’t change regardless on the number of sessions which are active. Contrary, database time (DB time) are those blue cubes where Oracle gathers information about the session activity (service time – CPU statistics or wait event statistics).
Important to note and remember is that database time can be greater than elapsed time. Basically this means that multiple sessions were active for the investigated time period as you can see in the picture bellow.
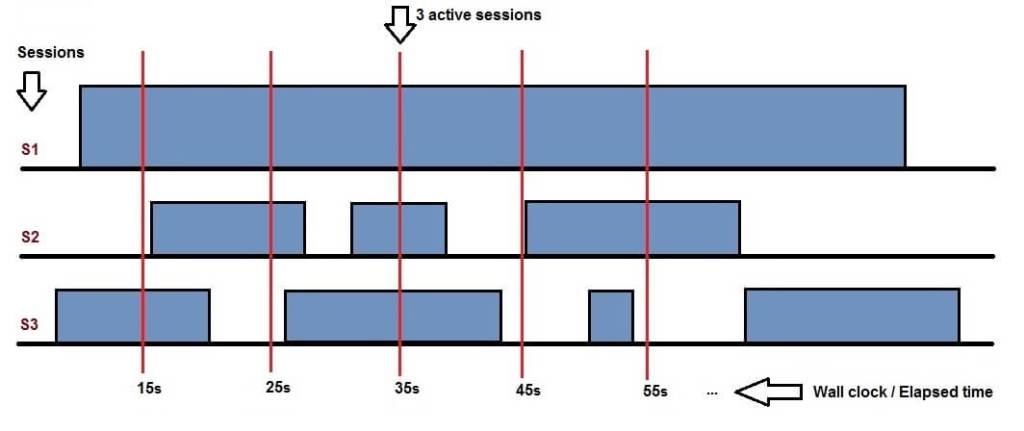
There are 3 sessions in the database. At the 15th second we see that only 2 sessions are active. Further at the 35th second we see that 3 sessions are actively performing some kind of activity. For all the sessions there is only one dimension for elapsed time (wall clock time). From the definition for average activity of a single session we can conclude that average activity for a multiple sessions is the sum of the average activity for each session. If we stack the cubes/sessions one over another ordered vertically by wait event class we would get something like the chart in EM.
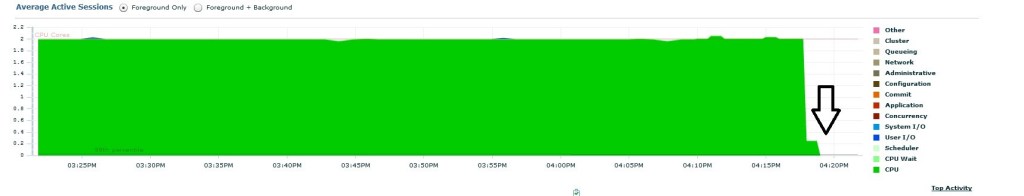
I’ve run several sessions with simple anonymous block wanting to simulate CPU load in order to populate the Average Active Sessions chart in EM. This is how the chart looked after some time.
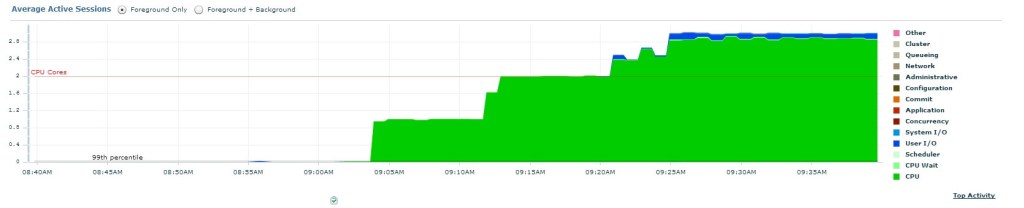
I’ve started first session around 09:05 and later between 09:10 and 09:15 I’ve started second session (executing the same code as session 1 for CPU load) and average active sessions jumped to 2 (same as CPU cores). After few minutes (after 09:25) I’ve started another third session to generate some I/O (blue wait event class on top of the chart). If average active sessions passes CPU Cores limit it means that some sessions will experience wait for CPU (CPU Wait).
When looking at these charts, the most important thing to remember is that we always need to tune/check the wait class event that occupies the most space. Remember, it is not about which wait event class is on top or bottom.
From this chart we see that, e.g. at 09:30 there are 3 sessions and most of the time is spend on CPU activity and some time is spend for I/O (see top of the chart).
Database Time and Average Active Sessions
Active Session History (ASH) is technique by Oracle to sample active sessions every 1 second in circular buffer in the SGA. We can think of ASH as history for database time. Since ASH is directly related with active sessions we can easily extract database time from ASH as ASH COUNT(*) = DB time.
The formula for Average Active Sessions would be: DB Time / Elapsed Time = Average Active Sessions
The data for active sessions is accessible from V$ACTIVE_SESSION_HISTORY dictionary view. Since the data is in memory (SGA) in circular buffer if you have very busy system it is very possible this data to be overwritten. Also, there is a SYS table DBA_HIST_ACTIVE_SESS_HISTORY where only 1 out of 10 samples is stored on disk, so that after instance restart we still have ASH data persistent on disk. In case we want to extract database time from DBA_HIST_ACTIVE_SESS_HISTORY it would be ASH COUNT(*) * 10 = DB time.
In the chart for Average Active Session (previous picture) if we want to calculate average active sessions between 09:05 and 09:30 we just need to do a little math. Divide database time with elapsed time for the given period of 25 minutes (1500 seconds).
DB Time = 3144 Elapsed Time = 25 minutes = (25 * 60) = 1500 seconds
Average Active Sessions would be: 3144 / 1500 = 2.096
SQL> select count(*)  DB_TIME,
  2  count(*) / (25 * 60) AAS
  3  from       v$active_session_history
  4  where      session_type = 'FOREGROUND'
  5  and sample_time between to_date('08012015 09:05:00','ddmmyyyy hh24:mi:ss')
  6                          and to_date('08012015 09:30:00','ddmmyyyy hh24:mi:ss')
  7 /

   DB_TIME        AAS
---------- ----------
      3144      2.096
I’ve added filter for FOREGROUND session type because ASH also gathers information for background processes.
One of the best possibilities with ASH is that data is rolled up in different dimensions and which gives us many possibilities. For example we can find top sql_id activity ordered by DB time consumption:
SQL> select count(*), sql_id
  2  from   v$active_session_history
  3  where  session_type = 'FOREGROUND'
  4         and sql_id is not null
  5  group by sql_id
  6  order by 1 desc
  7  /

  COUNT(*) SQL_ID
---------- -------------
     29274 3t431hgtbs8t7
        11 4ztz048yfq32s
         5 0uuczutvk6jqj
         3 f5yun5dynkskv
         2 4mua4wc69sxyf
         1 2ft0vv13g0xkd
         1 3y5p8203p74hn
         1 934ur8r7tqbjx
         1 459f3z9u4fb3u
         1 72cjd89q7d2s5
         1 65gavqa851ymj

11 rows selected.
Further, we can investigate the sql_id from v$sql.
SQL> select sql_text from v$sql where sql_id = '3t431hgtbs8t7'
  2  /

SQL_TEXT
---------------------------------
begin loop null; end loop; end;
To find the session ids that executed sql with high DB time we can use the following.
SQL> select count(*), sql_id, session_id
  2  from   v$active_session_history
  3  where  session_type = 'FOREGROUND'
  4         and sql_id is not null
  5  group by sql_id,session_id
  6  order by 1 desc
  7  /

  COUNT(*) SQL_ID        SESSION_ID
---------- ------------- ----------
     14637 3t431hgtbs8t7        135
     14637 3t431hgtbs8t7        373
         5 0uuczutvk6jqj        125
         4 4ztz048yfq32s          5
         3 4ztz048yfq32s         19
         3 4ztz048yfq32s          7
         3 f5yun5dynkskv          7
         2 4mua4wc69sxyf        125
         2 65gavqa851ymj          7
         1 72cjd89q7d2s5        125
         1 3y5p8203p74hn        374
         1 934ur8r7tqbjx        125
         1 459f3z9u4fb3u          5
         1 2ft0vv13g0xkd        125
         1 4ztz048yfq32s         14

15 rows selected.
Once all sessions that consumed CPU were killed there was significant difference in the Average Active Session chart.